Data-Driven
Performance Analytics
Ditch spreadsheets. Explore the detailed visual analytics designed specifically to help traders locate their edge and optimize risk.
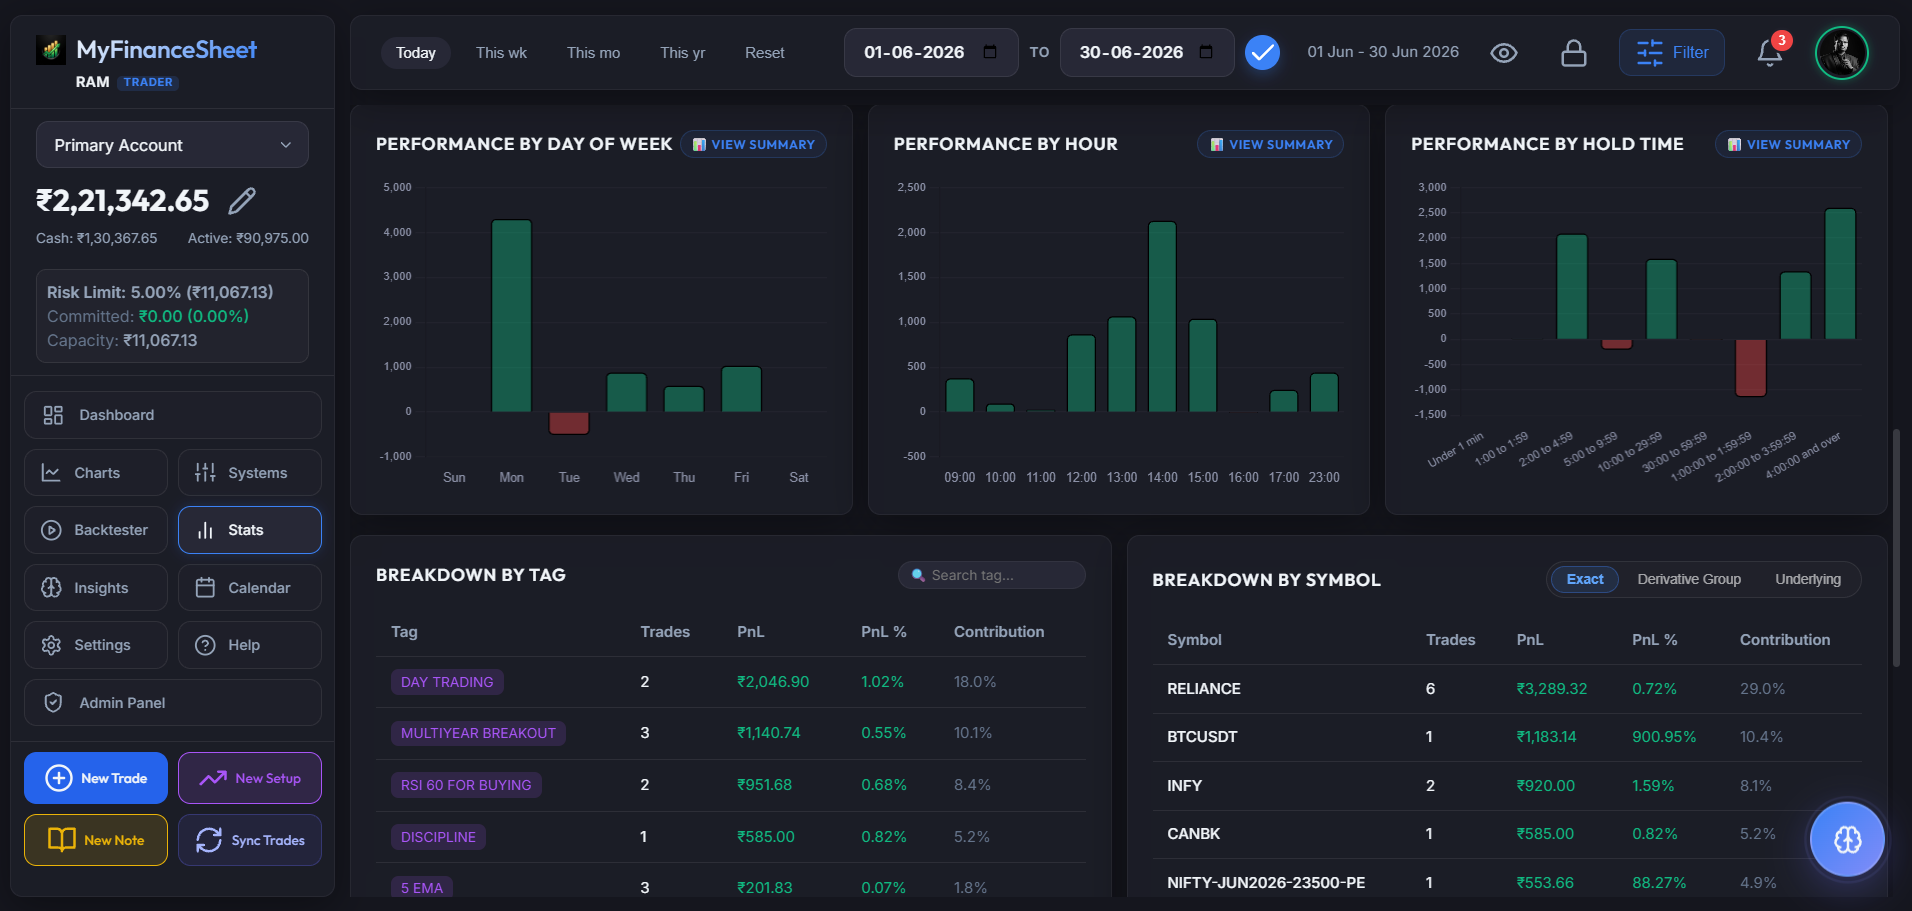
Visual Trade Analytics & Edge Trackers
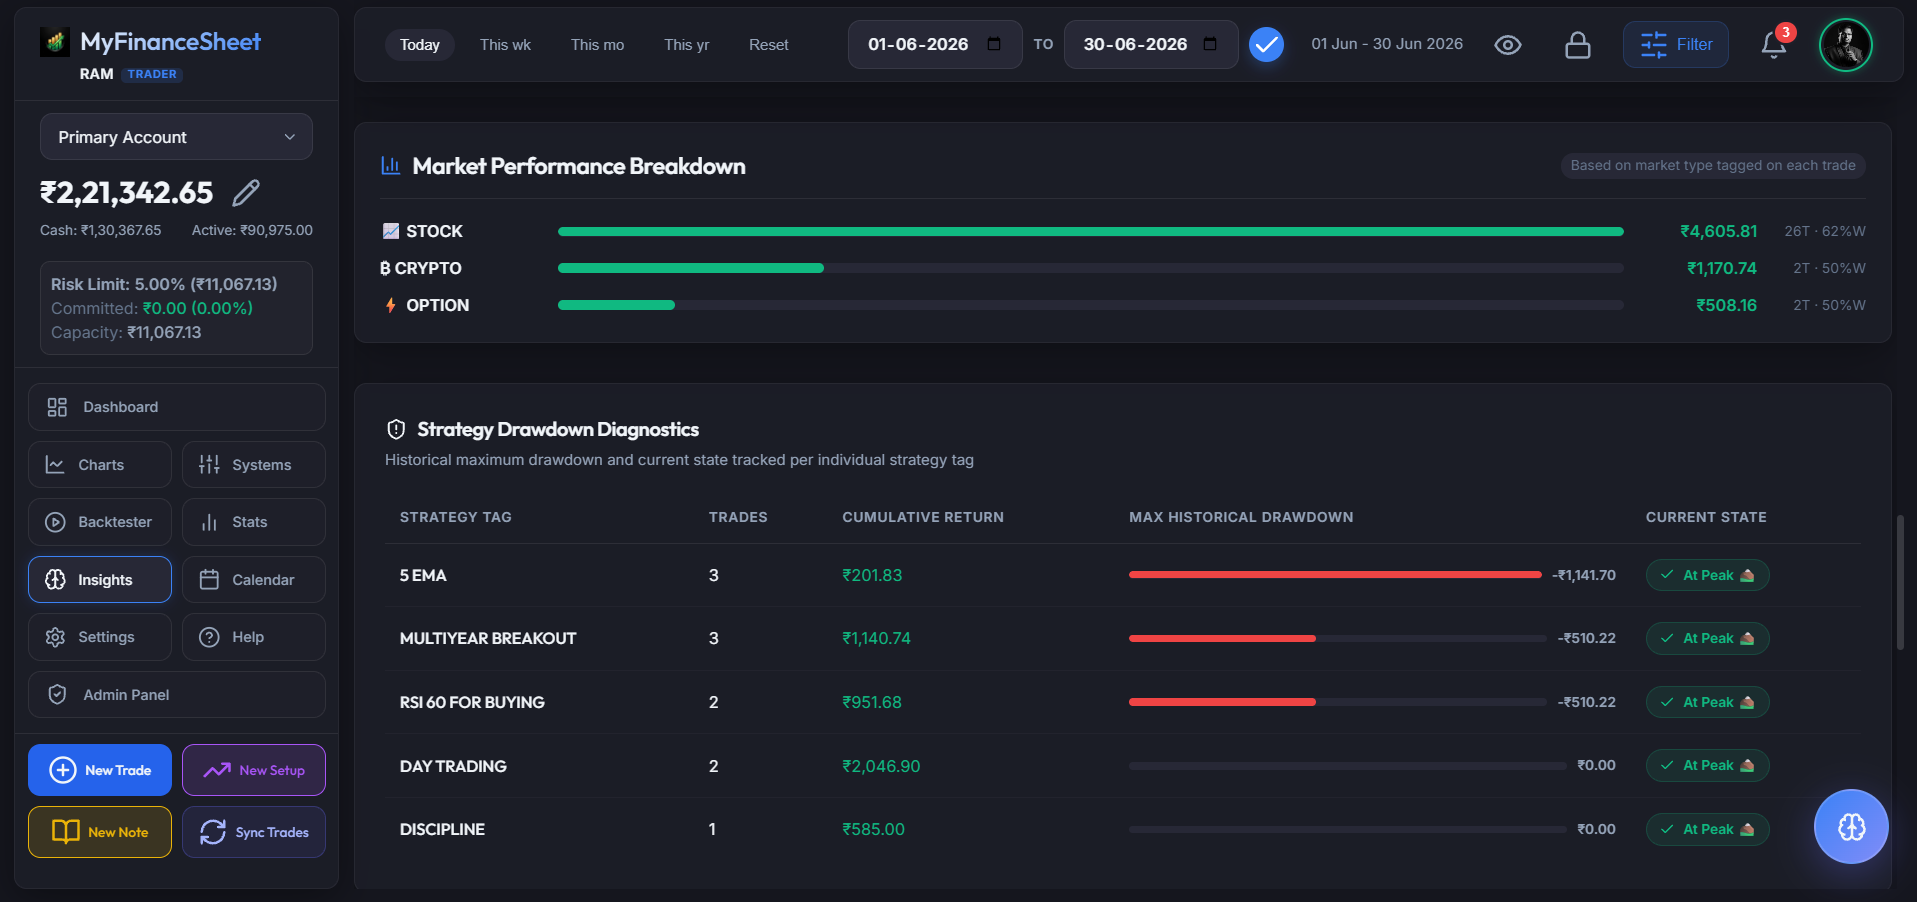
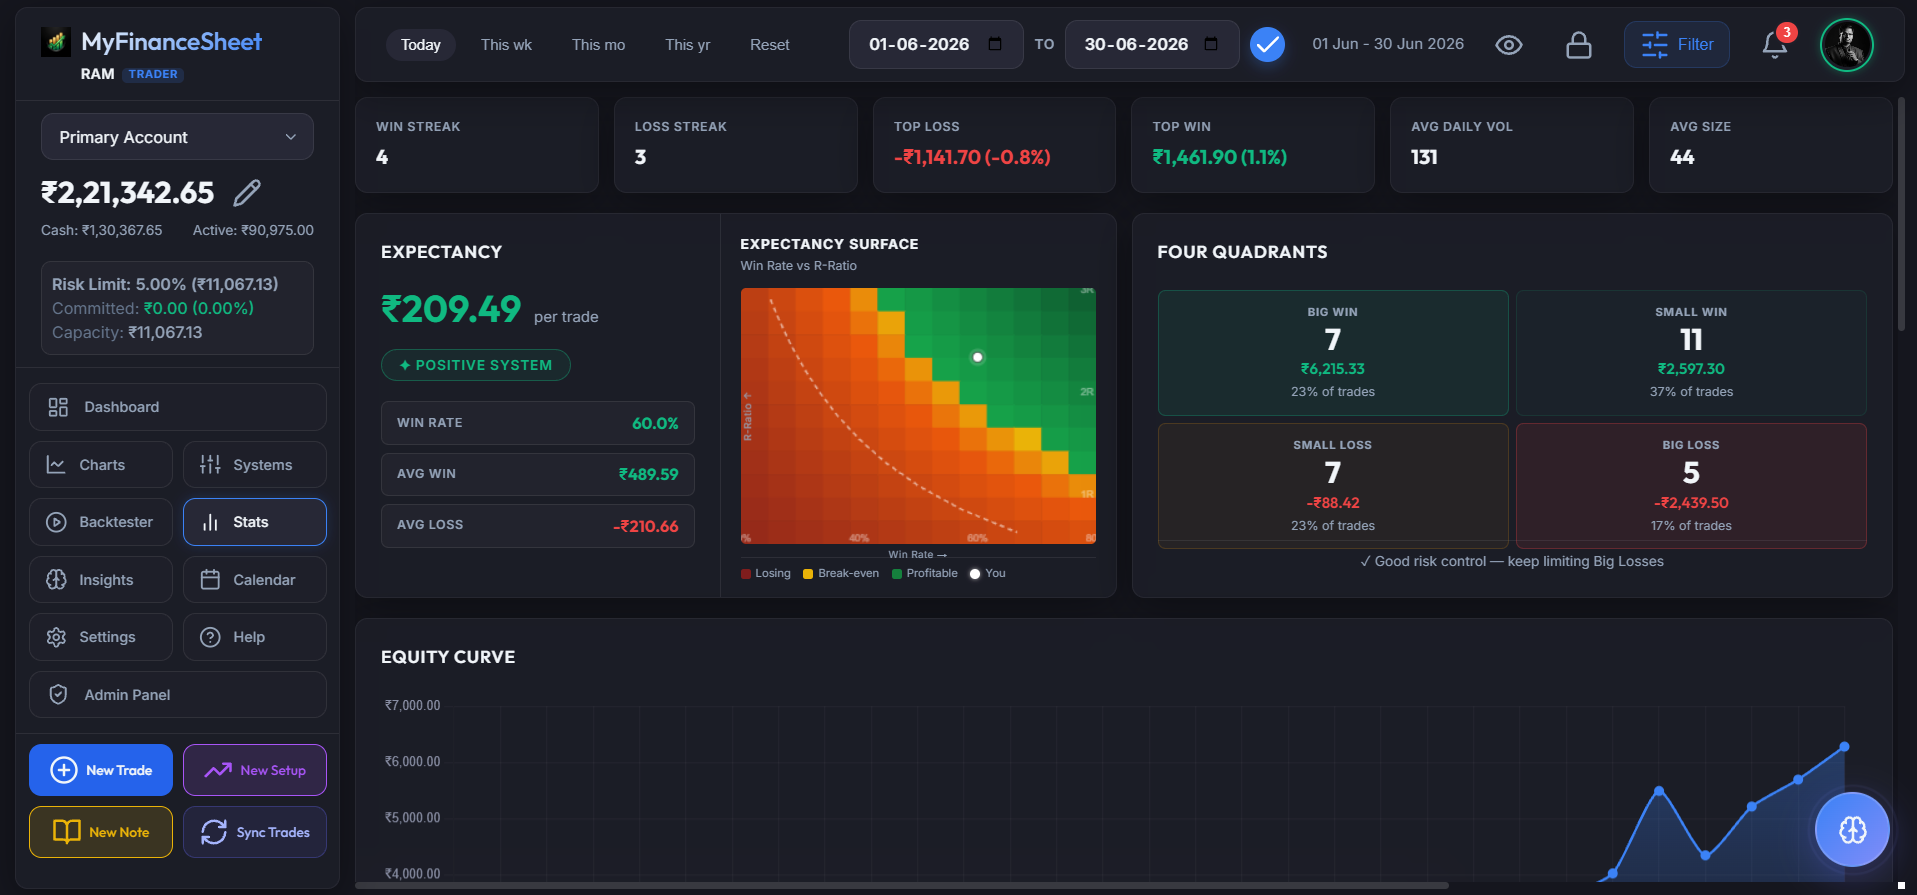
Evaluate your mathematical edge instantly. Track performance distributions across days, hours, and holding times, while examining tag and symbol breakdowns to identify where your setups excel.
- Day-of-week & Hourly win percentage analysis
- Breakdown by mindset tags and setups
- Asset-wise net returns and symbol performance
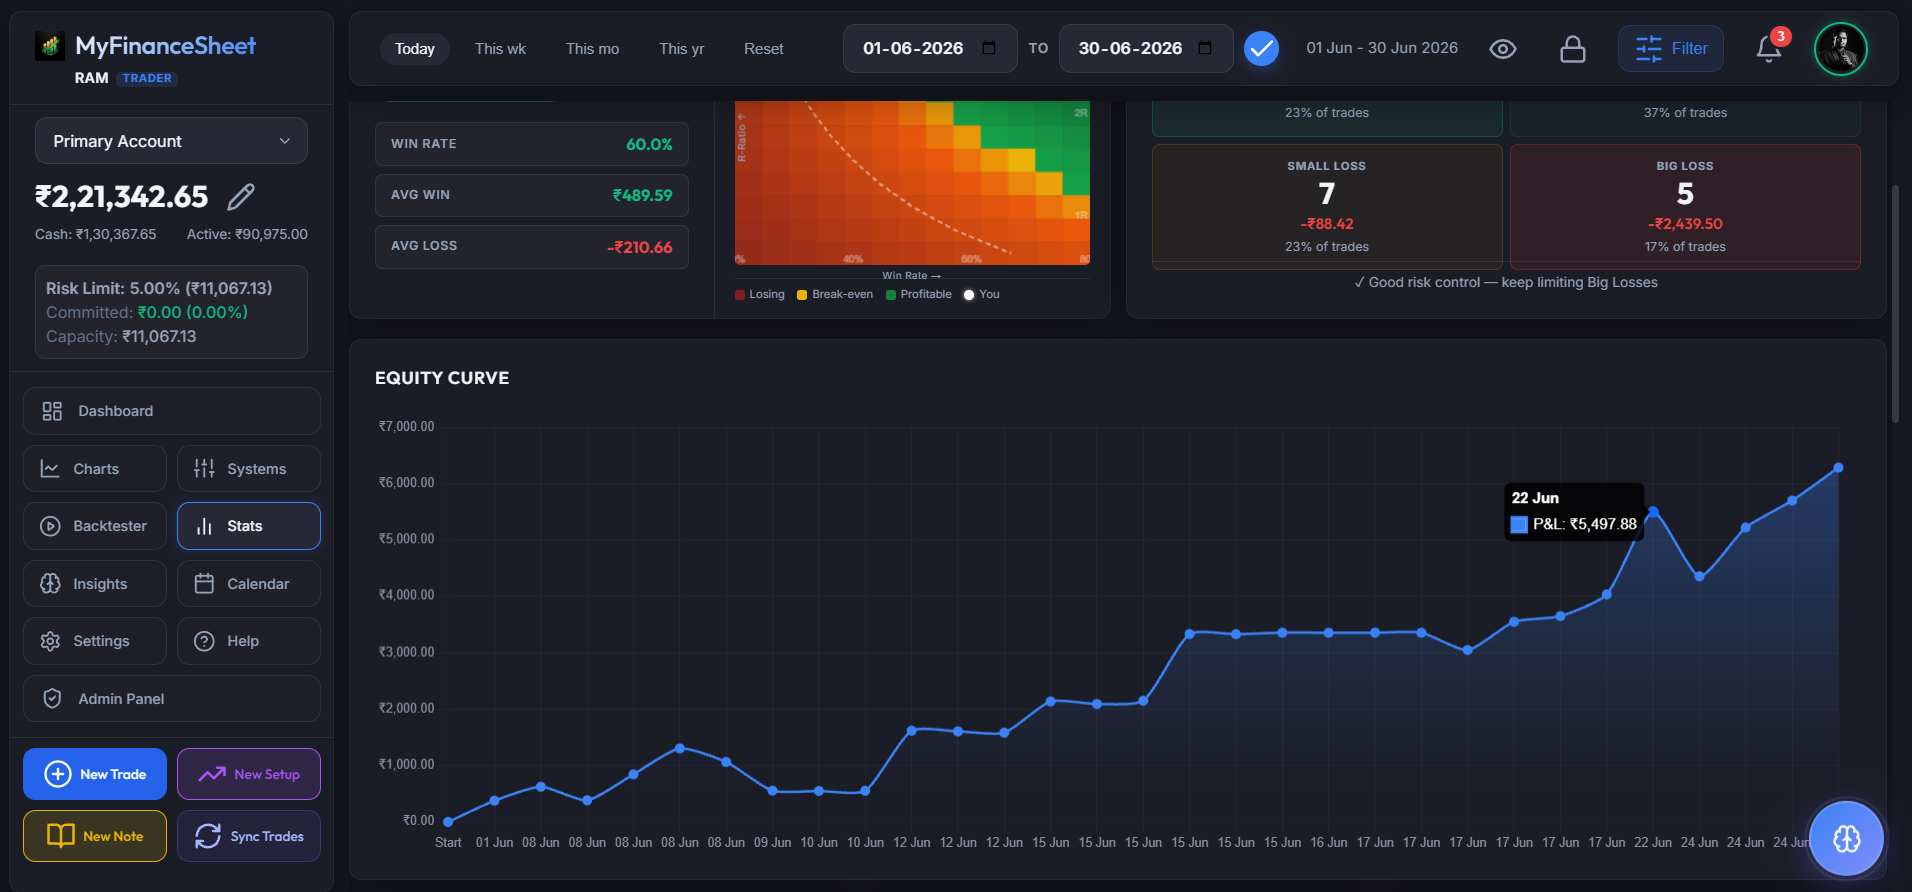
Your Trading Journey & Leaks Analyzer
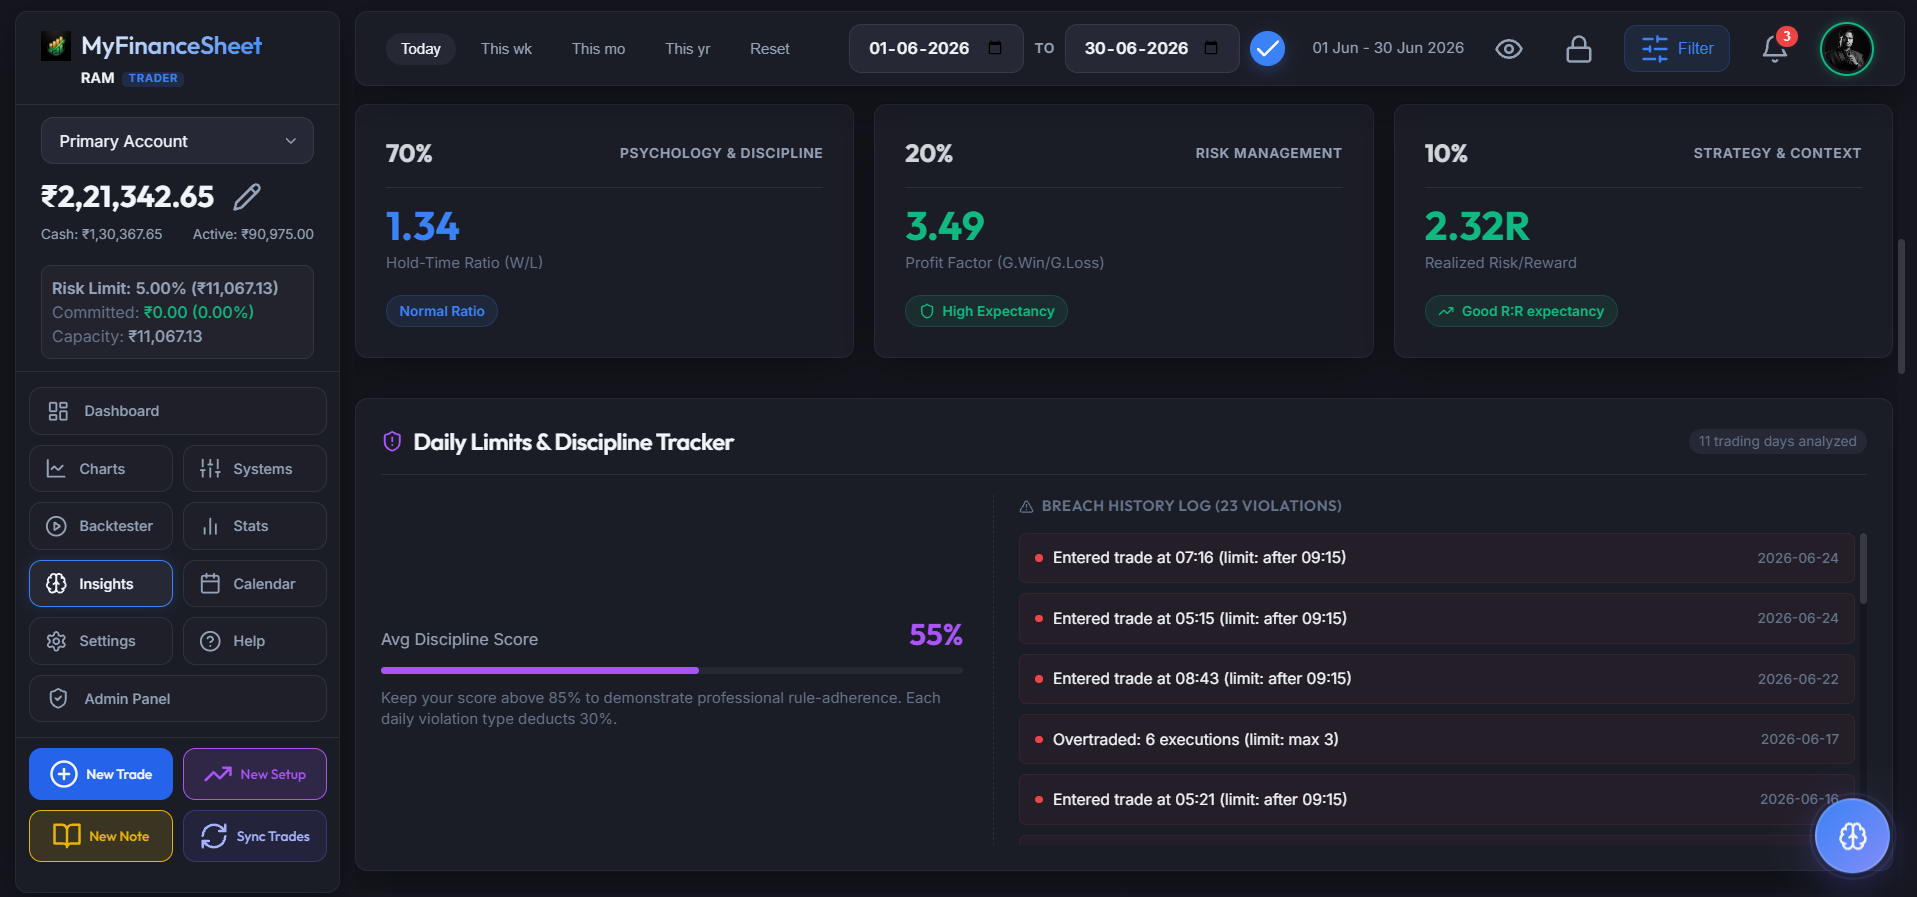
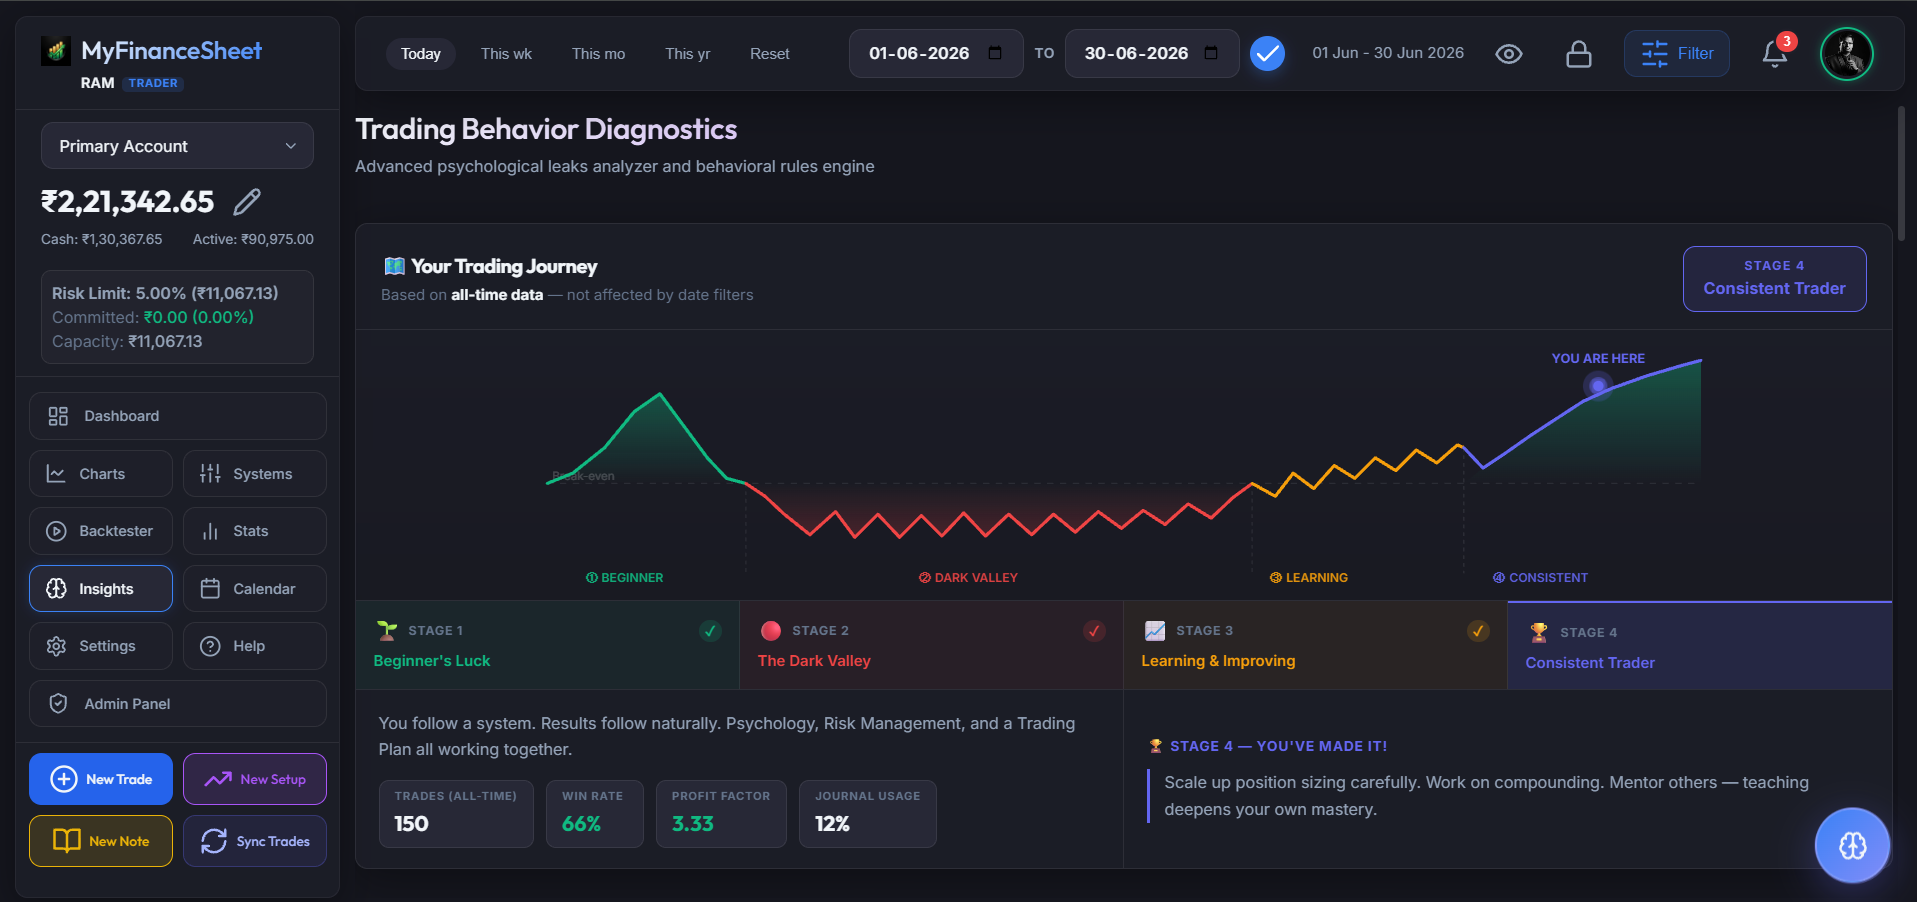
Analyze your psychological evolution. Track your trading consistency across four dynamic stages: Beginner's Luck, The Dark Valley, Learning & Improving, and the Consistent Trader phase.
- Stage-based progress tracking
- Automated rules infraction warnings
- Behavioral feedback triggers linked to ROI curves
Profitability by Holding Duration
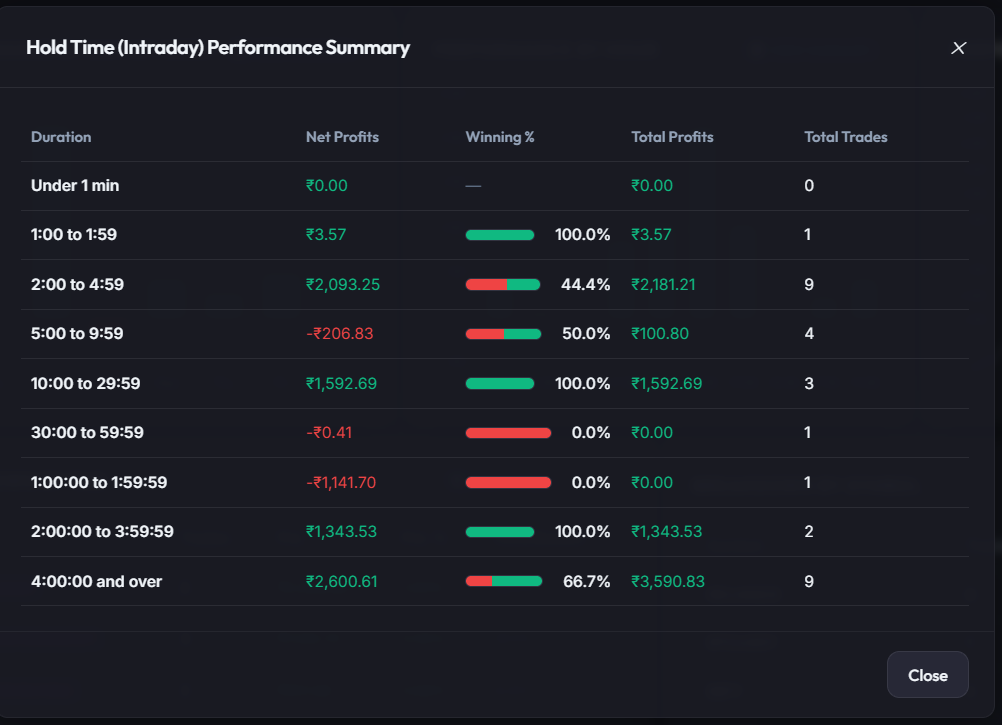
Analyze trade holding times to detect over-trading or premature exits. Directly compare winning trade durations against losing ones to find your trade holding sweet spot.
- Hold time metrics mapped against net returns
- Average hold time trackers for scalp vs swing setups
- Clear indicators for holding-loss patterns
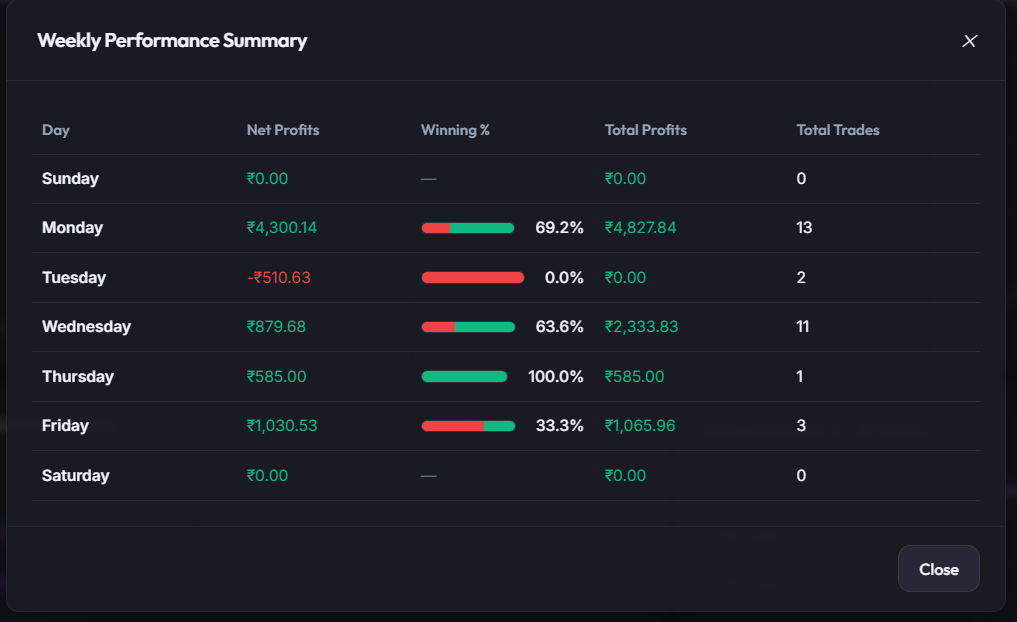
Weekly Performance Summary
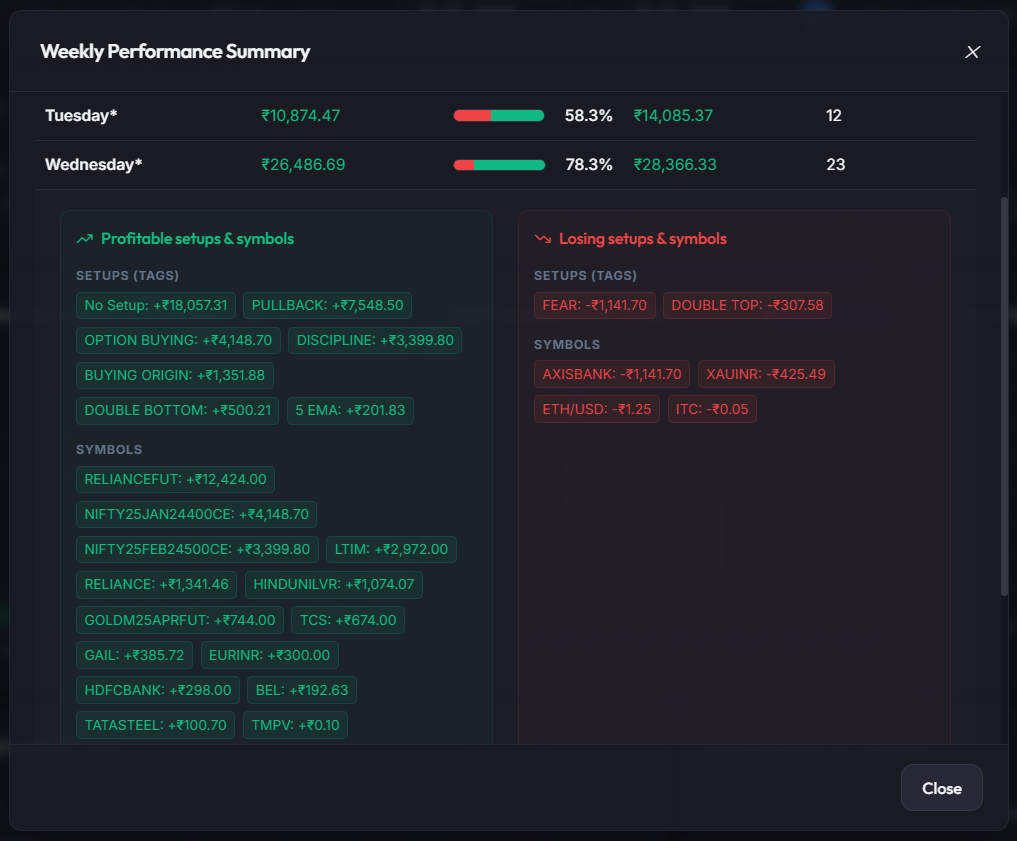
Analyze weekly execution setups and symbol performance. Identify which trading days produce the highest accuracy and isolate session patterns to maximize returns.
- Weekly setup performance accuracy
- Breakdown of profitable vs losing symbols by day
- Optimized calendar-slot recommendations
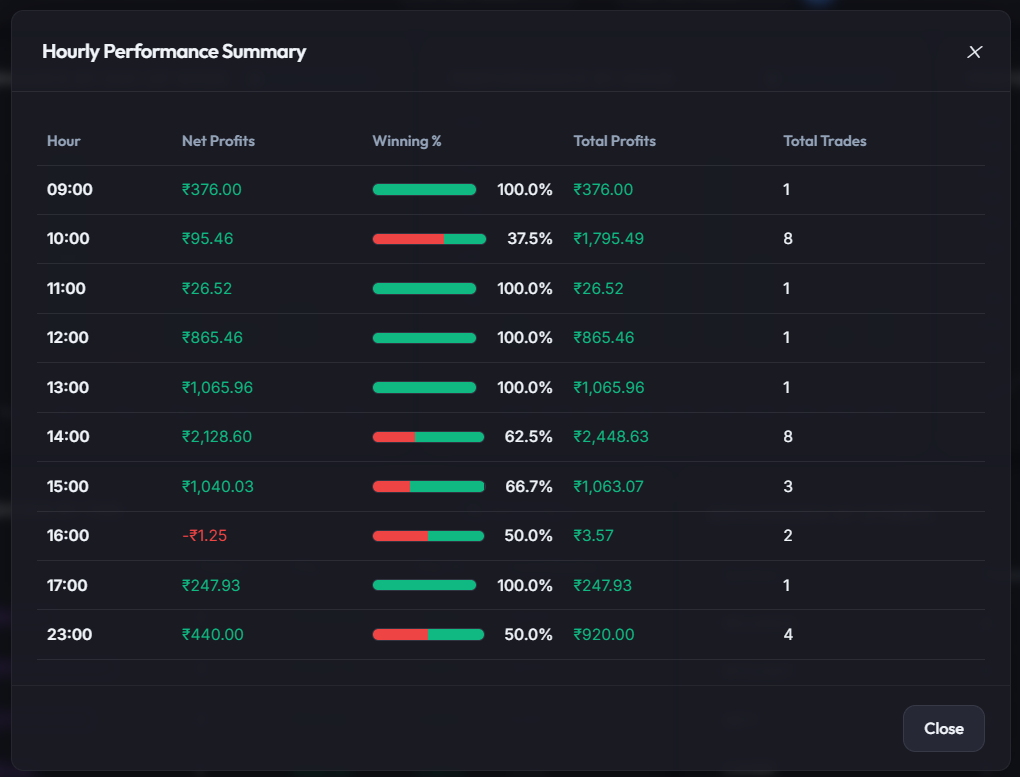
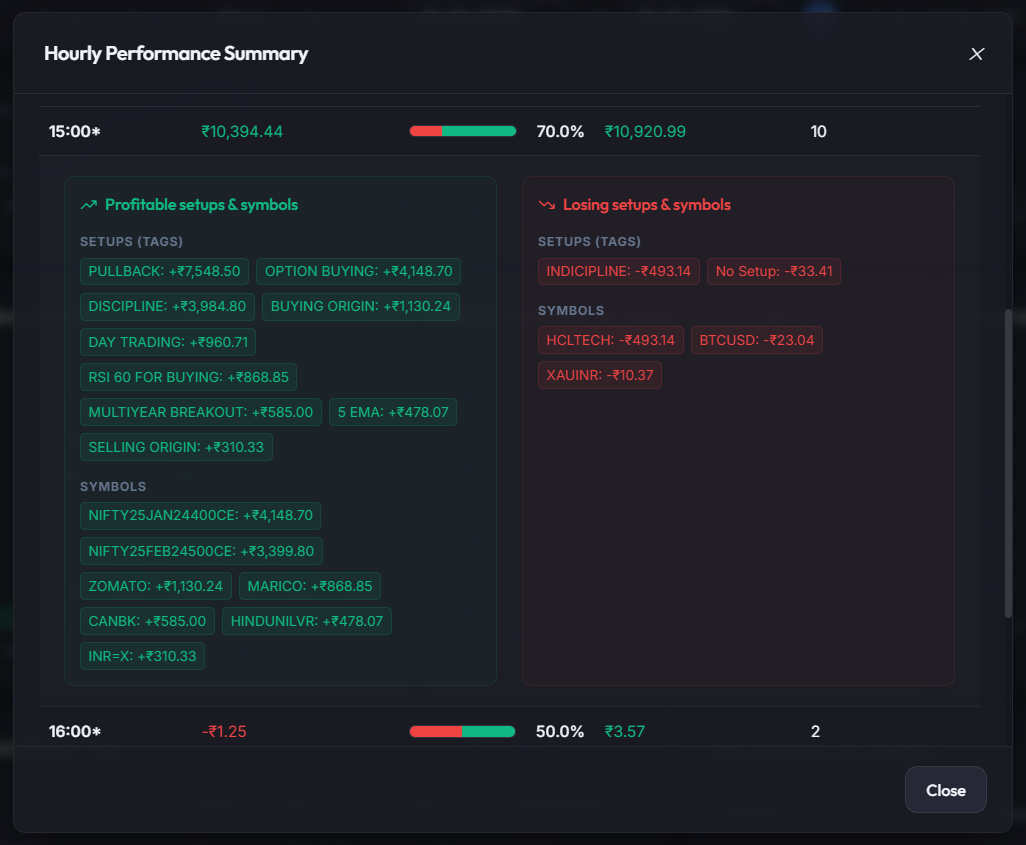
Hourly Performance Summary
Examine hourly performance distributions to pinpoint profitable setups and symbols. Avoid low-expectancy time slots and trade only when your setups have historical backing.
- Hourly win rate distributions
- Setup efficiency metrics per hour
- Losing symbol detection by session time
Hold Time (Intraday) Performance Summary
Compare setup accuracy and symbol performance directly against holding durations. Fine-tune your exit targets and stop-losses to optimize scalp and intraday executions.
- Hold time diagnostics for profitable setups
- Target and stop placement optimization
- Isolate overholding patterns on losing symbols
 Performance Summary profitable & losing setup & symbols.png)
Psychological Tag Correlation Engine
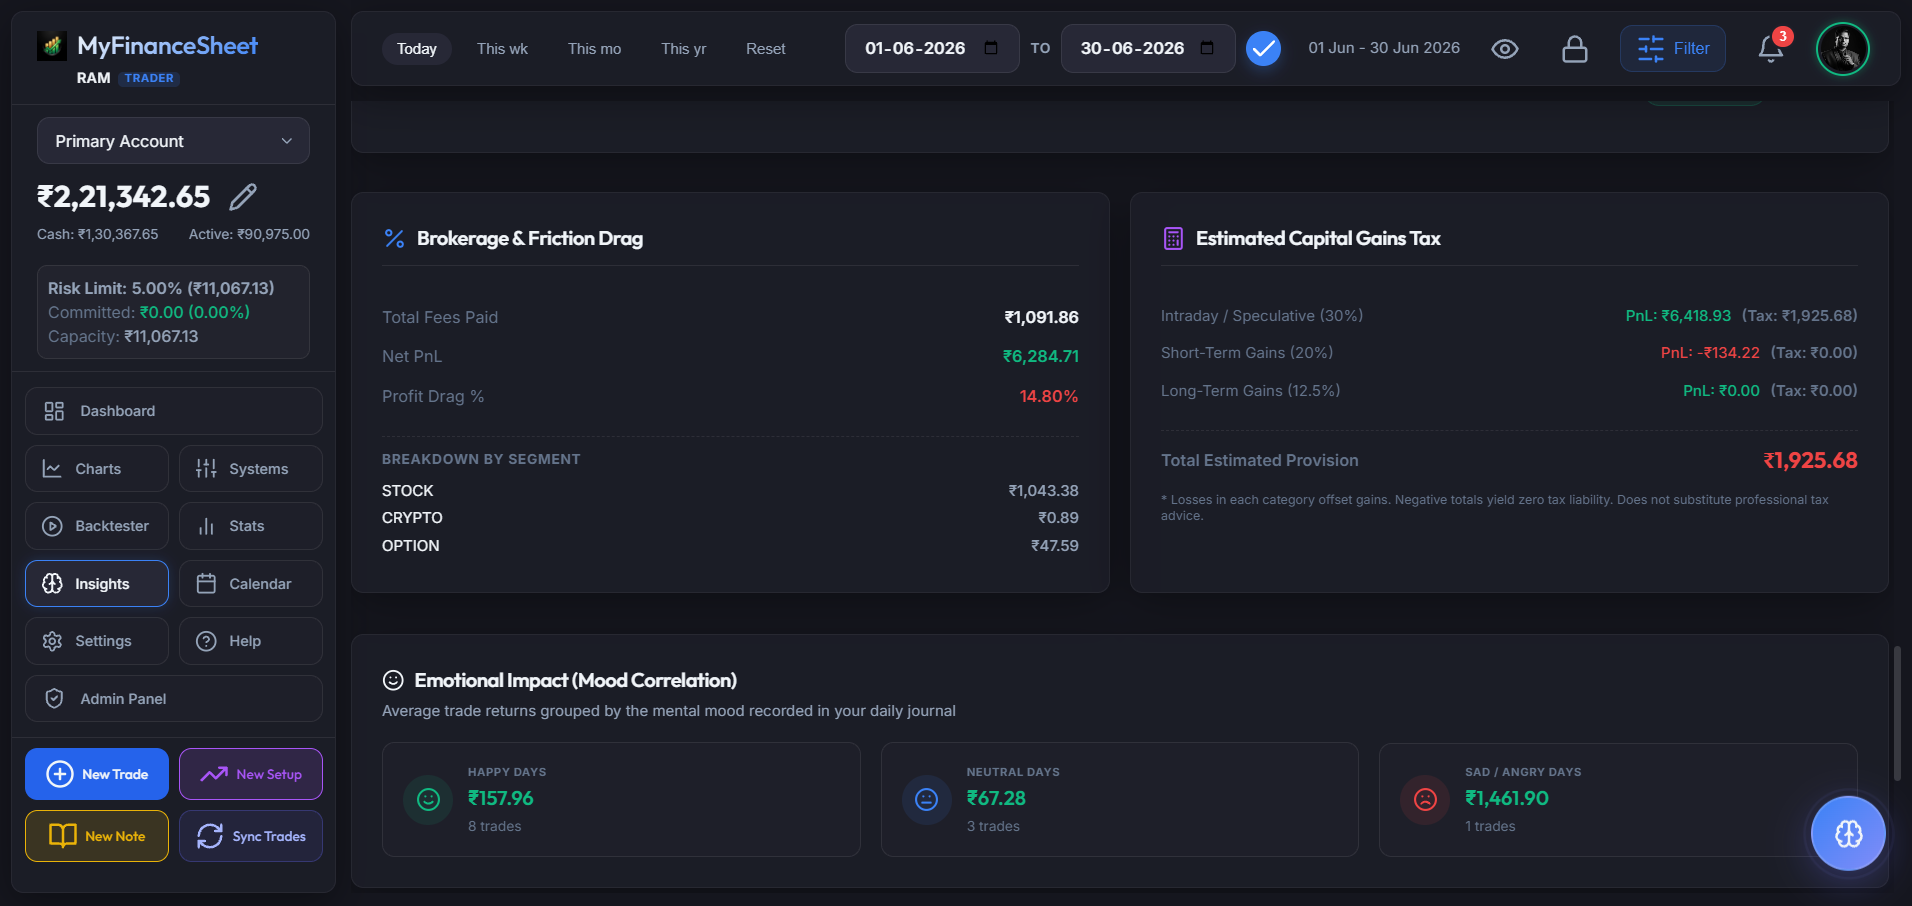
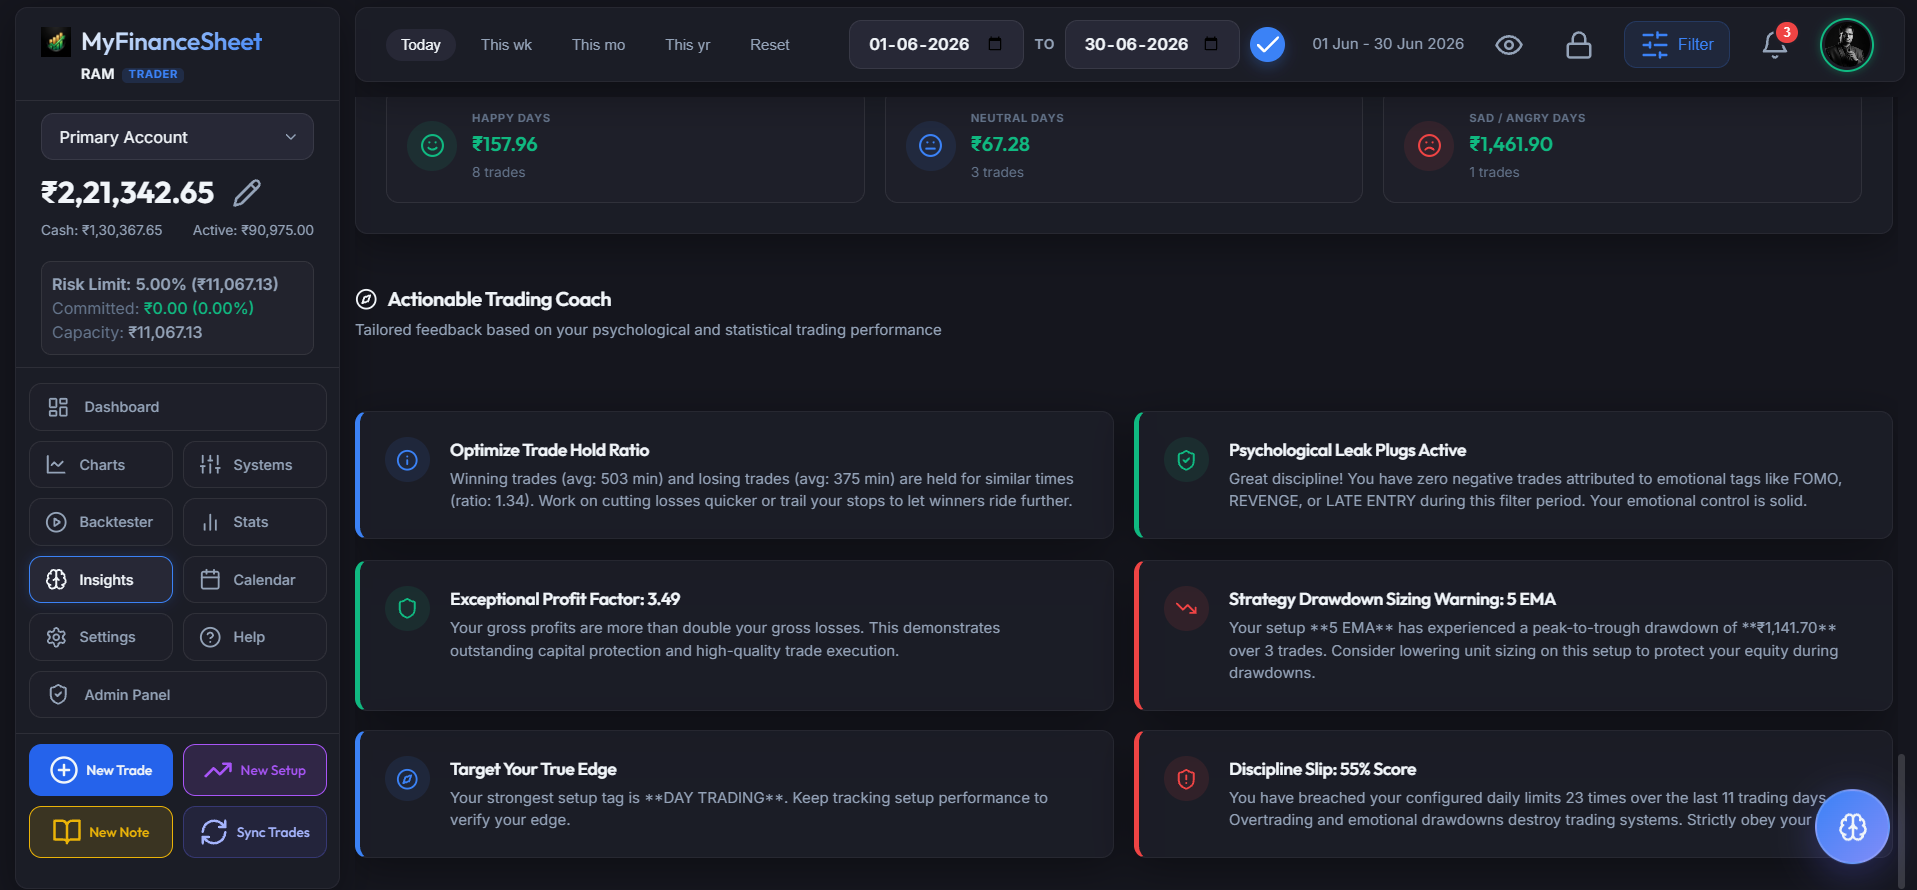
Trading is 90% psychological. Our metrics engine correlates your net profit directly with emotional tags (e.g. #FOMO, #RevengeTrading, #Disciplined) to show you the direct cost of mental leakage.
- ROI and profit charts grouped by mental state
- Clear indicators showing the exact cost of indiscipline
- Custom setups correlated with tag combinations
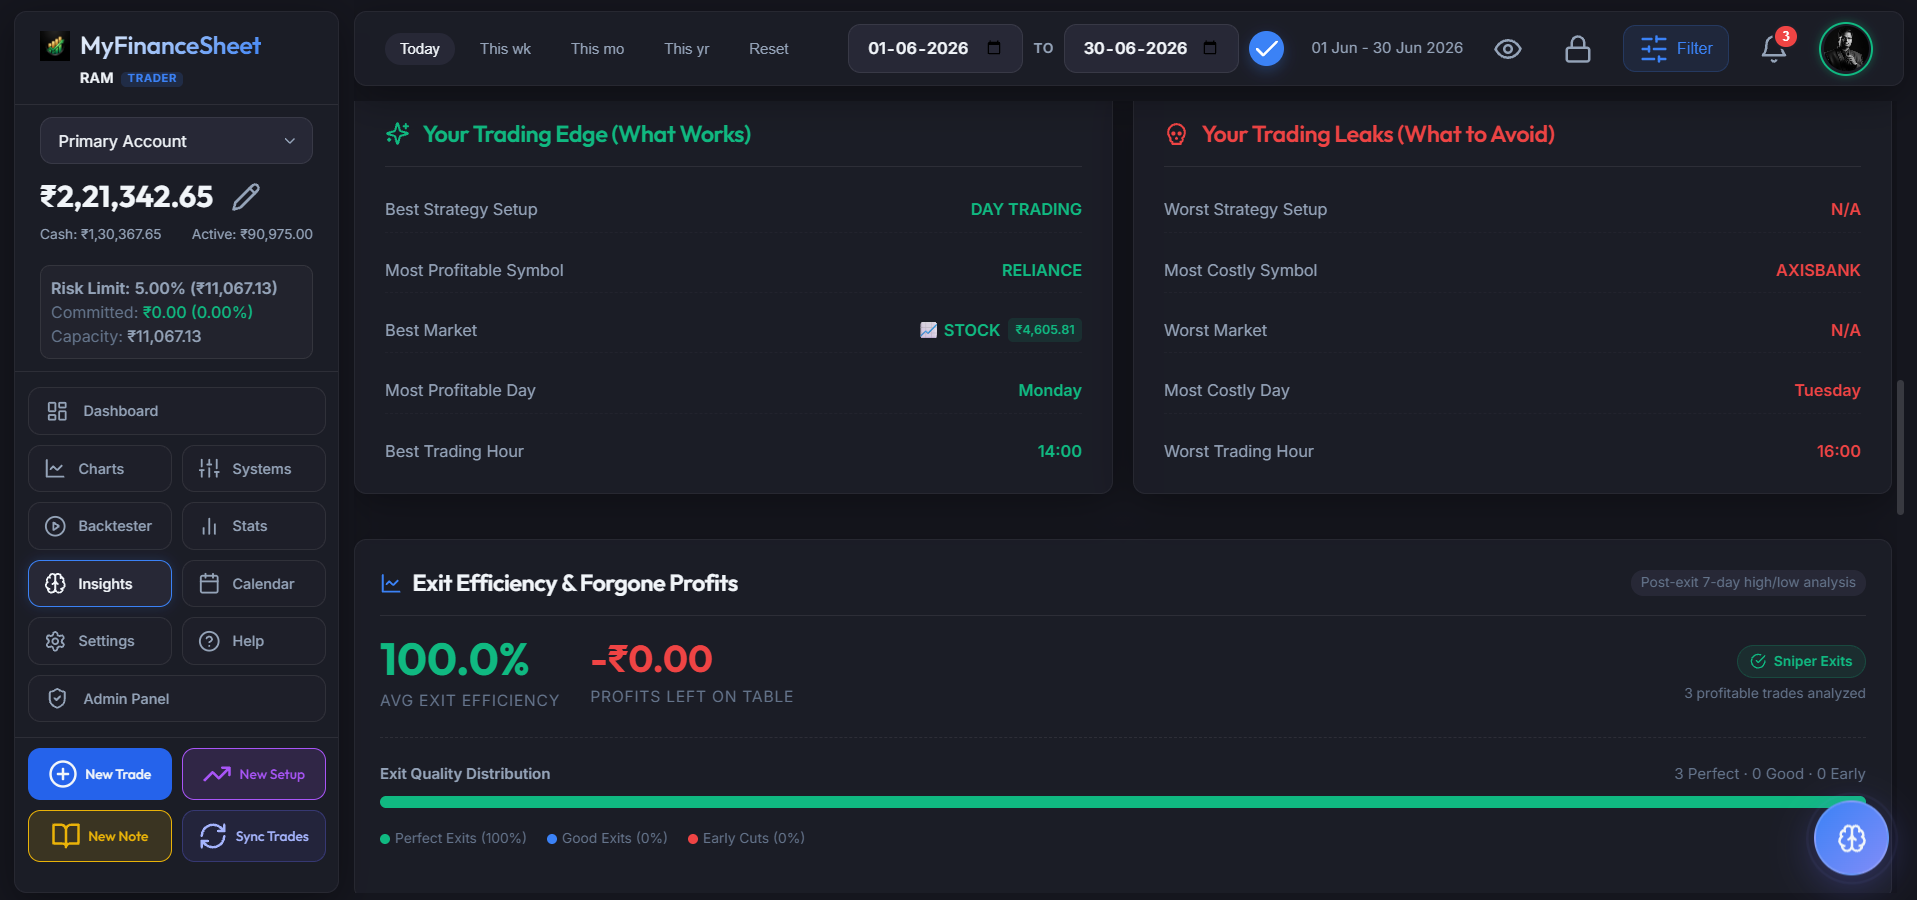
Interactive Dashboard Explorer
Click through the tabs below to preview the actual interface sections of the MyFinanceSheet analytics dashboard.